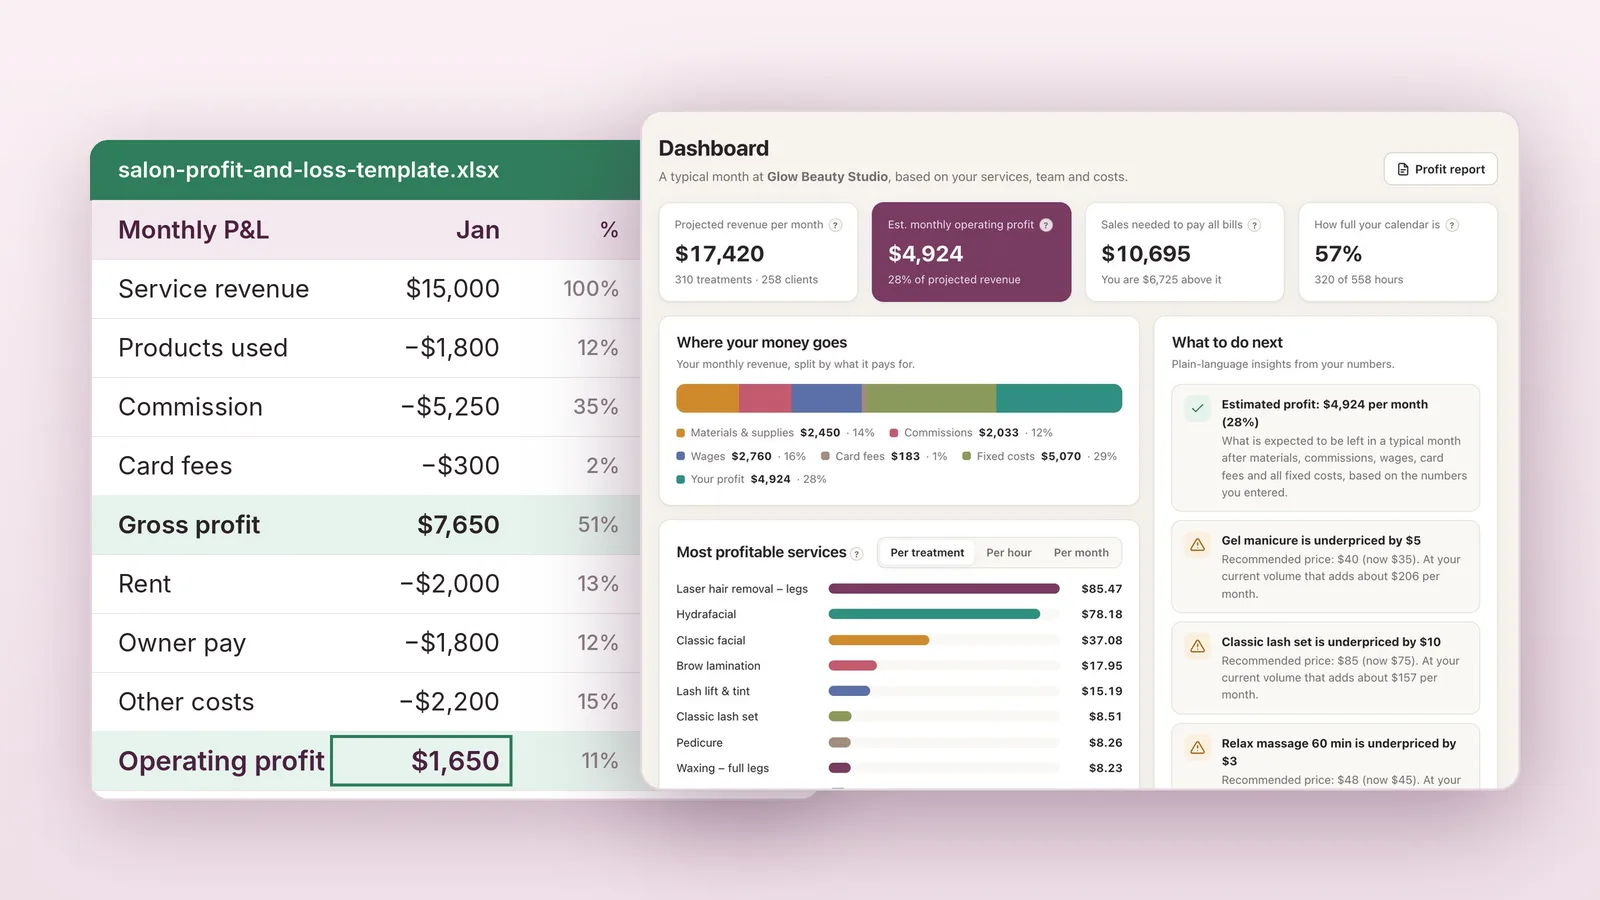
A salon profit and loss (P&L) statement lists one month's revenue, then subtracts cost of sales (products, commission, card fees) and operating expenses (rent, pay, bills). In our free template, a salon with $15,000 of service revenue keeps $1,650 of operating profit, an 11% margin.
- Always include your own pay as an expense
- Break-even revenue = operating expenses ÷ gross margin
- A P&L hides underpriced services: in our demo, 3 of them cost $447 a month
A salon profit and loss statement (P&L) answers one question: did the salon make money this month, and where did the rest go? It starts with your revenue, subtracts the costs that grow with every client (products, commission, card fees), then the costs you pay every month anyway (rent, wages, your own pay, bills). What is left is your operating profit. Download our free template below and fill it in at the end of each month.
Download the free salon P&L template
The template works in Excel, Google Sheets (File → Import) and Apple Numbers. It has a Monthly P&L tab with all 12 months and a year total, a % of revenue column, and a Key numbers block that calculates your margins and break-even revenue for you. Yellow cells are yours to fill in.
Download the salon P&L template (.xlsx) →
Free, no email needed. January is filled in with the example below so you can see how it works.
What goes on a salon P&L
Every salon P&L has the same three blocks. The order matters, because each subtotal tells you something different:
| Block | What goes in it | What it tells you |
|---|---|---|
| Revenue | Services + retail, no VAT or sales tax | What clients paid |
| Cost of sales | Products, commission, card fees | What each client costs |
| Gross profit | Revenue − cost of sales | What is left for bills |
| Operating expenses | Rent, all pay, bills, marketing | Cost to run the salon |
| Operating profit | Gross profit − expenses | What you really earned |
Operating profit is before income tax and before any loan repayments, so ask your accountant what to set aside for those.
Example: one month at a 3-chair beauty salon
Here is a typical month for a small salon with a team on 35% commission:
| Line | Amount | % of revenue |
|---|---|---|
| Service revenue | $15,000 | 100% |
| Products used in services | −$1,800 | 12% |
| Commission (35%) | −$5,250 | 35% |
| Card fees | −$300 | 2% |
| Gross profit | $7,650 | 51% |
| Rent | −$2,000 | 13.3% |
| Owner pay | −$1,800 | 12% |
| Part-time reception | −$900 | 6% |
| Utilities | −$400 | 2.7% |
| Software, insurance, accountant | −$420 | 2.8% |
| Marketing | −$300 | 2% |
| Repairs, laundry, small supplies | −$180 | 1.2% |
| Operating profit | $1,650 | 11% |
Example numbers. If you sell retail, add retail revenue and the cost of the retail products you sold.
The salon is busy and pays everyone, including the owner, and keeps $1,650. That is a healthy month, but notice how thin it is: commission alone is three times the profit. Try your own numbers below.
Test discounts and fewer clients too in the free demo's what-if simulator →
The 5 numbers to check every month
Your P&L is most useful when you compare the same few numbers month after month. The template calculates all of them:
- Gross margin = gross profit ÷ revenue. Example: 51%. If it drops, product use, commission or discounts are eating your prices.
- Operating profit margin = operating profit ÷ revenue. Example: 11%. Commonly quoted salon margins are about 5–15%; see our salon profit margin guide.
- Commission as % of service revenue. Example: 35%. If it creeps up without revenue going up, compare pay models in commission vs salary.
- Rent as % of revenue. Example: 13.3%. Our salon rent guide shows how much rent your salon can carry.
- Break-even revenue = operating expenses ÷ gross margin. Example: $6,000 ÷ 0.51 = $11,765. Below that, the month loses money. More in the break-even guide.
The template also has a booked hours line. Divide service revenue by it to get revenue per booked hour: $15,000 ÷ 290 hours = $51.72. If that number falls while you are just as busy, your prices are falling behind your time.
Common salon P&L mistakes
- Leaving out your own pay. Then the "profit" is really your wage, and the salon looks healthier than it is.
- Putting yearly bills in one month. Insurance, licences and software paid yearly should go in as 1/12 every month, or one month looks terrible and the rest look great.
- Mixing VAT or sales tax into revenue. Tax you collect for the government is not your money. Enter revenue without it.
- Treating a new machine as one month's expense. A big equipment purchase is usually spread over its useful life. Ask your accountant how to handle it, and use our equipment payback guide before you buy.
- Confusing profit with cash. Deposits, gift cards, loan repayments and stock purchases move cash without being profit or cost in that month. A P&L and your bank balance will rarely match exactly.
Your P&L shows the month, not which services cause it
A P&L tells you the salon earned $1,650 this month. It does not tell you that the gel manicure booked 70 times earns almost nothing per hour.
To fix a weak P&L you need to go one level deeper: profit per treatment, per hour and per team member. That is where a spreadsheet gets slow and where a dedicated calculator helps:
| Monthly P&L | Pricing calculator | |
|---|---|---|
| Looks at | Last month, the whole salon | Every treatment and team member |
| Profit per treatment and per hour | No | Yes |
| Suggested prices | No | Yes |
| Break-even and daily client targets | Break-even only | Yes, per day, week and month |
| What-if (price rise, promo, pay change) | Copy the sheet | Instant simulator |
| Cost | Free template | One-time payment |
Most salon owners need both: the P&L to check the month, the calculator to decide what to change. See it with an example salon in the free demo of the salon profit calculator, or read how to find which treatments really make money.
Example: what the calculator finds that a P&L can't
Here is the example salon from our free demo, "Glow Beauty Studio". On a P&L its month looks fine: about $17,420 of revenue and $4,924 of operating profit. Nothing on the P&L says a single price is wrong.
The calculator's Pricing screen looks at every service separately, and finds three that are priced below what they cost plus the profit the owner wants to keep:

| Service | Price now | Suggested | Extra per month |
|---|---|---|---|
| Gel manicure | $35 | $40 | +$206 |
| Classic lash set | $75 | $85 | +$157 |
| Relax massage 60 min | $45 | $48 | +$83 |
| Total | +$447 |
From the demo salon's Pricing screen; monthly amounts are rounded, so they add up to $446 here.
Fixing three prices adds about $447 a month, or $5,362 a year, with the same clients. A P&L can't show this, because every service is mixed into one "Service revenue" line. The calculator is a one-time $29, so in this example it pays for itself in about two days.
Open the demo salon and see it yourself →
Checklist: your monthly P&L in 30 minutes
- Export last month's sales from your booking or card system, split into services and retail, without tax.
- Add up product purchases used in services (or count stock at the start and end of the month for a more exact figure).
- Enter commission and wages from payroll, including your own pay.
- Enter card fees from your card provider's monthly statement.
- Enter every fixed bill, with yearly bills as 1/12.
- Check the 5 key numbers against last month and the same month last year.
- Pick one thing to change: an underpriced service, a discount to stop, or empty hours to fill.
Frequently asked questions
Is there a free salon profit and loss template?
Yes. You can download our free salon P&L template (.xlsx) on this page, no email needed. It works in Excel, Google Sheets and Numbers, covers 12 months, and calculates gross margin, operating margin and break-even revenue for you.
What is included in cost of goods sold for a salon?
Costs that grow with every client: professional products used in services, the cost of retail products you sold, commission paid on those services and card processing fees. Rent, salaries and bills are operating expenses, not cost of sales.
Should I include my own salary in the salon P&L?
Yes. Put a realistic owner pay line in operating expenses, even if you only take money out when there is some left. Otherwise your profit is really your wage and you cannot see if the salon pays its way.
What is a good profit margin on a salon P&L?
Commonly quoted net margins for salons are about 5–15% of revenue, after paying the owner. Our example salon keeps 11%. Track your own margin monthly and compare it with the same month last year.
What is the difference between a P&L and cash flow?
A P&L shows what you earned and spent for the month. Cash flow shows money actually moving in and out of your bank. Deposits, gift cards, loans and stock purchases can make them differ a lot.
How often should a salon do a P&L?
Every month. It takes about 30 minutes once the template is set up, and monthly numbers let you catch a problem, like rising product use or a slow season, before it becomes a bad year.

Simple numbers for beauty businesses: pricing, profit and team pay, explained with real examples. More about us. Follow @salonprofitlab on Instagram for weekly tips.
This guide uses example numbers for illustration. It is not accounting, tax or financial advice.